The appreciation of the notion that time is priceless has led to the implementation of several dynamic decisional technologies in day-to-day business decision-making, where time and business revenue are directly or indirectly interrelated.
In light of decision-making concerning the intermediate factors conjoining the chief variables of time and revenue, businesses have to make forecasts to resolve uncertainties and gain a better understanding of future trends to fulfill their objectives.
The art of forecasting is not just restricted to corporations. Whenever we hear the word “forecast”, we typically associate it with the weather report. Whether presented by daily news segments or our mobile applications, these weather forecasts highlight data regarding weather trends over a period of time. This itself constitutes a prime example of time series forecasting–a decision-making tool we will discuss extensively in this article.
What is Time Series Forecasting?
Time series forecasting is a set of statistical techniques and data science methodologies that aids in predicting how a certain variable develops over time. Forecasting is generally divided into two categories: qualitative forecasting, where human experience-based decision-making dominates, and quantitative forecasting, which comprises an objective computerized discovery of patterns and insights within different datasets. Time series forecasting falls under the latter category.
The aim of time series forecasting is to determine how a target variable changes with time through the observance of historical datasets, establishing patterns and then ultimately yielding short or long-term predictions, capturing the change.
To achieve this objective, analytical professionals employ a diverse range of time series approaches, among which the predominant five are: (1) time series regression, (2) time series decomposition, (3) exponential smoothing, (4) ARIMA models, and (5) advanced tools consisting of neural networks and other techniques.
Although the predictions are not always exact, time series forecasting still gives us an overview of which outcome is more likely to occur than the other. The terms “forecasting” and “predictions” are often used in unison, disregarding a notable distinction.
In specific industries, forecasting may refer to an instantaneous position of data at a discrete time scale, whereas prediction may mean a generalized picture of data in the future. Usually, time series forecasting is used in conjunction with time series analysis which aims to understand the dependencies in data as it varies over time.
Forecasting corresponds to finding out “what will happen,” whereas analyzing tries to answer questions such as “what happens and why does that happen”.

When and Why use Time Series Forecasting
Various data mining and machine learning (ML) tasks, such as natural language processing (NLP), sound and image recognition, and regression and classification problems, operate with datasets that do not consider the temporal dimension. For instance, in the context of image recognition solutions, we are more concerned with distinguishing different objects rather than how they change over time. On the other hand, time series problems are always time-dependent.
Time series forecasting is amongst the most frequently used applied data science techniques in various industries such as finance, business, inventory, production planning, and supply chain management, with several use cases not limited to climate, weather, economics, retail, healthcare forecasting, and more. Furthermore, it occupies an important position in the ML sector with applications in regression, neural networks, random forests, and XGBoost algorithms.
Naturally, however, when dealing with the unknown, there will be limitations. Every model will not be compatible with each dataset. Analytical professionals should only implement time series forecasting techniques once they understand the business question and have the appropriate capabilities to answer it. A good practice is to work with a clean, time-stamped dataset. Since there are no hard-and-fast rules, it is up to the data teams’ expertise to acknowledge the limitations of analysis and design an appropriate model. A good forecasting technique can separate the fluctuations and outliers from the dominant insights and thus identify the direction in which a variable evolves over time.
The Basic Steps for Conducting Time Series Forecasting
The time series forecasting process usually involves the following five processes:
- Problem Definition: Often the most cumbersome part of the project, problem definition requires a thorough understanding of how the forecast will be utilized, who requires it, and how its function fits within the organization. To do so, the forecasting project manager must establish effective communication channels with all project stakeholders.
- Information Gathering: To conduct the forecasting, we need the datasets and the expertise of the people who collect the data and utilize the forecast.
- Exploratory Data Analysis (EDA): Before advanced forecasting techniques can be implemented, analytical professionals need to know their dataset comprehensively and ensure that it is in a presentable form. This EDA process allows data teams to better understand the variables and the relationship between them through summary statistics and various visualization techniques while also making it easy to spot anomalies, understand insights, test hypotheses, and verify assumptions within the dataset.
- Selecting Models: Once the dataset is adequately manipulated, an appropriate model is determined based on the availability of historical data, the type of the dataset, the magnitude of the relationship between the explanatory and forecast variable, and the use case of the forecast. Each model is constructed on its own set of assumptions and parameters, and comparing more than two potential models for forecasting requirements is common.
- Using & Evaluating the Selected Model: Once the model and its parameters are established, forecasts are then generated, and the model performance is evaluated once the results are available.
Five Important Approaches to Time Series Forecasting
The appropriate forecasting method depends mainly on what sort of data is available. Each method has its own properties, costs, accuracies, and use cases where it performs the best when we need to observe a variable sequentially over time. Alongside real-world examples, we will now highlight the most essential five models fundamental to the process of time series forecasting:
- Time Series Regression
One of the most commonly applied time series forecasting techniques is through regression models. The basic concept is that we attempt to forecast the mathematical relationship between the predictor and the forecastvariable.
The most common type of regression is the simple linear regression which assumes a linear relationship between the single predictor variable 𝑥 and forecast variable 𝑦 in the form:
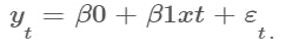
The coefficient coefficients β0 and β1 represent the intercept and the gradient of the line illustrated below, whereas εt is the error. The term “error” does not imply a mistake; instead, it accounts for the deviation of a coordinate from the best fit line.
Whenever we are applying the linear regression models in our time series forecasting process, we have to make certain implicit assumptions regarding the variables in the above-mentioned equation:
- The model is a reasonable approximation to the reality
- The errors have a zero mean, are not autocorrelated, and are unrelated to the predictor variable.
- The predictor variable 𝑥 is not a random variable.
These suppositions allow us to establish a framework that ensures that the forecasts will not be systematically biased or inefficient.
In several scenarios, we often have to work with more than one predictor variable. A general form of this multiple regression framework is:
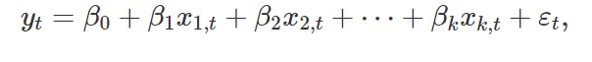
Where 𝑦 is again the forecast variable, 𝑥1,…𝑥k are the k number of predictor variables, and the coefficients β0,…βk measure the marginal effects of each predictor.
A good example to highlight this model will be through the US consumption expenditure historical dataset. We can construct a multiple linear regression model to accurately forecast the country’s consumption trends as it depends on income and other predictors such as production, savings, and unemployment. Scatterplot matrices of the individual variables are then graphed, and the correlation between them is examined to yield a forecast.
Although we have assumed a linear relationship between variables so far, there are many applications where the nonlinear functional form is more suitable.
- Time Series Decomposition
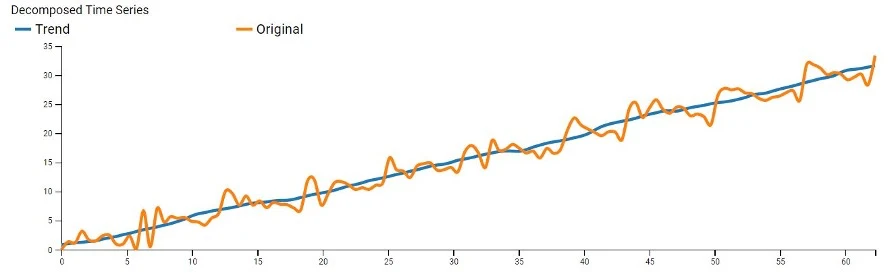
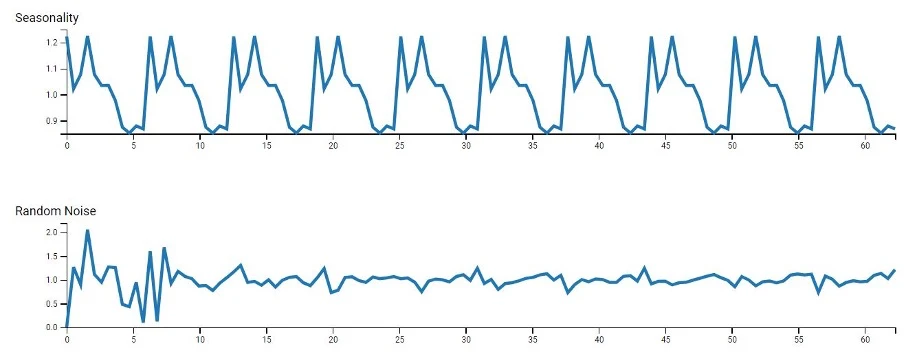
Time series datasets often exhibit a variety of underlying patterns, which makes it practical to split a time series into its components:
- Trends: It describes how a variable changes over a long period of time.
- Seasons: It showcases repeated variable fluctuations in a fixed length of the time period.
- Cycles: These are long-term, recurring patterns similar to seasonal patterns but not confined within a fixed time period.
- Noise: These represent the unexpected patterns in the variable growth over time.
The following graphs represent how these models deconstruct a time series into these components.
Most decompositional models initially perform the moving average smoothing technique to diminish the stochastic nature of data, making it easier to identify trends. Analysts then follow up with classical decomposition methods or the more advanced techniques: X11 decomposition, SEATS decomposition, or STL decomposition. These methods are particularly useful for forecasting retail sales over extended periods.
- Exponential Smoothing
This method forms the basis of some of the most powerful forecasting methods. To summarize, it employs weighted averages of past observations, with the weightage decaying exponentially the older the observation is. This means that the forecasts generated are reasonably accurate and closely resemble the latest shape of the dataset. Some of the types of this model include: single exponential smoothing (SES), where only time series is weighted; double exponential smoothing (DES), in which both trend and time series are weighted; and the Holt-Winters method, which produces forecasts based on weighted averages of seasonality, trend, and time series.
To highlight the application of this process, we can apply SES to forecast oil production in Saudi Arabia. Considering a dataset that captures the monetary production volumes of oil from 1955 to 2013, analytical experts estimated a significant increase in oil production over the next five-year period–which we can seemingly confirm now.
- ARIMA Models
Autoregressive integrated moving average (ARIMA) models are also one of the most pervasive forecasting techniques. While exponential smoothing models produce forecasts based on the historical data component, ARIMA takes it further and produces forecasts based on autocorrelations in the data.
Before we can delve into the particulars of the ARIMA model, it is fundamental to first understand the concept of autoregression. Like linear regression, autoregression comprises forecasting the variable of interest but using the linear combination of past values of a variable. Combining this with a moving average model, the forecasts match with the linear combination of past forecast errors, yielding a non-seasonal ARIMA model, assuming that the time series is stationary.
Another branch of these models is the seasonal–SARIMA models, which use the addition of seasonal terms (past values and forecasting errors) to the model. For instance, we can implement a SARIMA model to forecast the European quarterly retail trade with data captured between 1996-2011. After accounting for seasonal differences and choosing an appropriate model based on the plotted ACF and PACF, we will be ready for forecasting.
- Neural Network Models
Neural networks are rapidly gaining popularity and employability in the AI sector in the recent decade. It attempts to replicate the human nervous system as it comprises a network of “neurons”, with the bottom layer as predictors and the top layer forming the forecast. The simplest neural networks are equivalent to linear regression models. Once the hidden (intermediate) layer is introduced, the model becomes nonlinear and allows us to evaluate and forecast complex nonlinear relationships between the predictors and the response variable.

Although neural network tools are broad, RNNs and LSTM networks are particularly efficient for time-series-specific applications. It enables the network to retain information, ignore extraneous input, and manipulate forecasting procedures to solve complex time series problems which otherwise are too difficult or impossible to solve through classical methods. For example, telecommunication companies can use neural networks to forecast sunspot activities that ultimately affect radio waves’ propagation. This enables them to plan for future arrangements and alternatives.
Conclusion
This concludes our analysis. In this article, we have thoroughly laid down what exactly time series forecasting is, why it is needed in our current digital landscape, and highlight various users and real-world practical applications of this statistical tool. We have also discussed an overview of the forecasting process, followed by five prevalent forecasting approaches in different sectors.
Now that we have a basic understanding of time series forecasting and its surrounding technologies, it will aid decision-makers like you to formulate the forecasting problems adequately and have more confidence in the resultant forecasts while making their appropriate use.