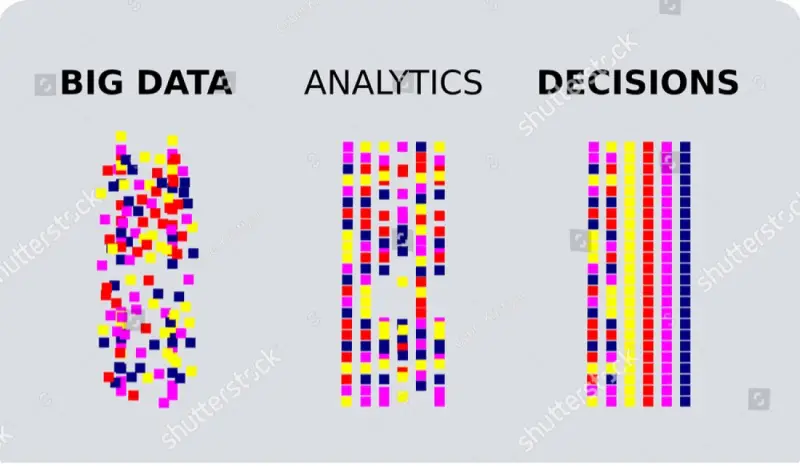
When a business grows, the amount of data that is being collected will increase simultaneously. The main question here is what you will do with all the big data that is being collected? How will you use it for your own benefit? What good will all that data do for your business? This is where data analytics will help you out. This is the technique of finding out specific insights from your data to use it to improve the future of your business. Not only that, but it also saves you from drowning in all the data that you have collected by giving it some structure.
As the title of the article may suggest, in this article, we will primarily be focusing on what data analytics is and what are the different workflows of data analytics.
Through the course of this article, we will be covering:
- What data analytics is
- How it is done, and what are some types of it
- What makes data analytics so important
- Finally, we will move on to data analytics workflows along with a few examples
What is Data Analytics?
Before diving into the description of data analytics, you first need to understand what Data Science is. In simpler terms, data science is a field of computer science that deals with collecting substantial amounts of data and finding patterns and meaningful insights from it by means of modern technologies such as machine learning.
Data science is a vast field, whereas data analytics is merely a subfield of data science. Data analytics focuses more on the answers that have already been extracted and finding out even more specific details from them. This is useful because when dealing with copious amounts of data, some helpful information is often lost in the process. Data analytics algorithms work in an equivalent manner to data science algorithms, and this entire process also follows the same steps which are namely collection, storage, cleansing, analyzing, and representing outcomes.
The outcome of this process has multiple uses.
For example:
- They can be used as an input to other processes – Finding out what made one product famous and adding that characteristic to other products.
- These insights are commonly used to make future decisions of any company – If a company should continue or discontinue a particular product based on its reviews.
- They can also be used to improve current conditions – Conducting a survey and releasing a product based on the demands of your customers or how to get you hooked to their product.
Here Are A Few Types of Data Analytics:
There are four distinct types of data analytics, and fortunately for you, we will briefly describe all four of them here.
The four types happen to be:
- Descriptive
- Prescriptive
- Diagnostic
- Predictive
| Descriptive Analysis | Prescriptive Analysis | |
| Method | Theoretical | Machine Learning Tools |
| Objective | Performance Checks | Future Products |
| Type | Structured | Unstructured |
Two types, i.e., descriptive and prescriptive analysis of data analytics, have been compared in the table above to show how the different types differ.
Descriptive
A descriptive analysis tells you the behavior of something over a period of time. For instance, if you wanted to see how your sales have been going for the last month, you would opt for descriptive analysis.
Prescriptive
Like a prescription given to you by a doctor, a prescriptive analysis also provides you with suggestions that you can follow to improve your business.
Diagnostic
In this process, the entire dataset is analyzed, and the output will give you a diagnosis of the whole situation and tell you what went wrong.
Predictive
This approach of data analytics is usually adopted when one must predict the reaction or the outcomes of the decisions, they will be making in the future to see if those decisions will prove to be beneficial for them or not.
All these methods follow the “Six Sigma Program” that is used to cancel out the chances of inaccurate results by removing defective data.
What Makes Data Analytics So Important?
The importance of data analytics has proliferated over time because every company needs to find out how people have been reacting to their products. Not just that, data analytics is being used in every field, such as in the medical field, where data is collected from all around the world from multiple patients who suffer from similar diseases so that the insights from their cases can be used to find a cure for their illnesses.
The example above explains that data analytics has made the process of decision-making a lot more accessible by providing valuable insights in less amount of time so people can invest more time in the implementation process rather than trying to figure out what the causative factor is.
This is a more structured approach to making essential business decisions because you can plan out and divide your resources accordingly and increase the number of your customers by using the outcomes.
What Is End to End Data Analytics?
In generic terms, end-to-end data analytics can be considered as the interactions the customers make with the company. The interactions could be offline or online. The offline interactions are the reactions to the marketing campaigns or expenses made indirectly, and the online interactions are those done through the website or mobile applications, etc.
| Source of Data | Type Of Data |
| Surveys | Opinions/Advice |
| Website | Reactions |
| Mobile Applications | Number Of Users |
The table above gives a few examples of the type of data collected through different interactions with customers.
We will be covering in this topic the high-level steps of a typical end-to-end data analytics project so that you can have a better understanding of what it is. Before moving on to the steps, it is essential to know the type of data that you are working with. Whether it is transactional or analytical. Transactional data is the data you use every day for your business, whereas analytical data is the data that you use in the decision-making process.
The steps are as follows:
1. Collection:
You cannot just collect random data for this process. First, you must identify why you are collecting your data. In case you have multiple use cases, you must prioritize them with respect to their Return-on-Investment(RoI). During the collection process, you need to make sure that the data you are collecting meets the criteria for all the identified purposes and is as accurate as possible.
In case you are having problems identifying the purpose of your analysis, you can always consult and discuss the Key Performance Indicators (KPIs) with others for a clearer picture.
2. Test:
This step makes a dramatic difference in your results and saves you a lot of time and money because instead of going all in and jumping headfirst into the final project, you can make a prototype to test how it will work out for you. If the prototype does seem feasible to you, you can then approve it as your final project.
3. Process:
Now that you have collected the data and you have an approved plan for the project, you can now start shaping your data according to the requirements of your project. You can build up the necessary features and modify the model by validating your data accordingly. Make a set of test data that you can use in your project to see if you get the desired outputs. You can perform this step as many times as you want to until you are fully satisfied with the product.
4. Analyze:
To ensure everything is in place, you can analyze your data one last time by putting your project in an environment it was made for and analyzing the feedback you get from it. You need to monitor the project thoroughly. In case of any errors, you need to conduct a study to find the root cause behind it and get that fixed.
A valuable tool that helps you evaluate your data for this process is a Design of Experiment (DoE) software. This tool tests your data according to the given parameters and tells you how the provided data will affect your results.
Data Analytics Workflow
Data analytics workflow in data science explains the different steps taken in the entire project. It defines the path for the project and acts as an overall outline as well. You and your team will plan and organize your entire project based on these guidelines. That is why it is crucial to have a very well-defined workflow.
Considering how big of a part workflows play in this process, we will discuss some of the most important workflow frameworks here. There are, of course, many diverse types of workflow frameworks since it happens to be an old concept, but the frameworks under discussion here will be:
- CRISP-DM
- Feature Driven Development (FDD)
- OSEMN
- Kanban
CRISP-DM
This stands for CRoss Industry Standard Process – For Data Mining. As the name would suggest, it is a standard set of rules for data mining in industries. This happens to be the most popular data science workflow.
There are six different stages to this process those happen to be: Business understanding, the understanding, preparation, modeling, and evaluation of data. Every step has its own processes and tasks, and if there is a need for changes in the end, these steps can be repeated as many times as needed. After each stage, a report is delivered to make sure that the project is set on the right path and changes can be made as soon as something comes up.
Feature Driven Development (FDD)
This means that this approach focuses on one feature at a time. It works on one aspect of the entire process at one time, and once that is perfected, the team can move on to the next step of that process. In a way, the entire process is divided into distinctive features.
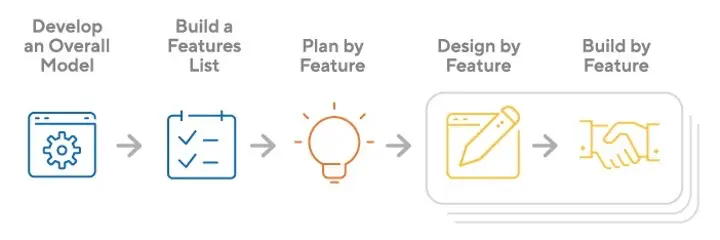
The image above is a pictorial representation of the different steps taken in this workflow, i.e., a model is first developed, which is then divided into all its features. Finally, according to a plan, the work is done on all those features.
OSEMN
This workflow framework was named after its processes, i.e., Obtain, Scrub, Explore, Model, and iNterpret, and this was discovered in 2010. The name itself is self-explanatory since it describes how this workflow works. In other words, this workflow has five different stages in which you obtain the data you are supposed to work with, clean it up by getting rid of all the redundant data, and experiment with it until you have found your best fit and, in the end, draft a report on it.
Kanban
In this method, all the several factors are represented visually on a kanban board. This representation makes it easier to see what part of your process requires more effort and what does not. This is a balanced approach because everyone is free to view the states of each process, and it is easier to identify what is going wrong and where.
Though all of this may seem simple for now, since, of course, it’s in high-level terms, there is so much that data scientists must be familiar with before they begin the work.
After reading the descriptions above, it may seem like both workflows perform the same task, so what makes one different from the other? The steps that are required to carry out the entire project are what differentiate different workflows from one another. While some workflows give better outputs after repeating the same actions repeatedly, others focus on understanding the content that is being fed into them before performing any processes over it.
All Things Considered:
Given the circumstances, data analytics has proved to be significant to us because we can find work on finding valuable insights even from extremely specific data sets. Data analytics workflows have made our work even more, especially for those who are currently beginners, by providing them with guidelines they could follow to analyze their data with ensured accuracy. Not only have they simplified the entire process of data analysis, but they have also made the decision-making process easier by providing reliable insights from our data.
