When it comes to improving the quality of your products and services, data analytic tools are the antidotes. Regardless, people often have questions. What are data analytic tools? Why are there different data analytic tools? Which one should I prefer? How to use that?
Data analytic tools provide a series of functions such as charts, maps, and diagrams that gather, analyze and demonstrate data for a broad range of applications and enterprises. These functions assist business owners to make smarter and worthwhile decisions that help in minimizing expenses and boosting profits.
To mark a difference as a first-class business in the market, businesses need data analytics tools. They help enterprises to better comprehend the clients, analyze the ad campaigns, customize the content, create content schemes, and develop products. And ultimately, these tools boost businesses’ performances and orient the businesses to a higher level.
If you’re not using digital tools, how can your enterprise grow then? Arthur C. Nielsen says,
“The price of light is less than the cost of darkness.”
By reading the stated quote and the above-mentioned benefits of these digital tools, you must have got a clue how important they are.
Now, we’ll provide you with a substantial answer to your query i.e., what are data analytics tools?
Although this is a complete run-of-the-mill topic, it is very crucial. Therefore, we have hunted through the internet and found the best analytical tools to help expand businesses by improving their productivity.
12 Most Sought-After Data Analytics Tools Of 2021
To get the most mileage out of the endless amount of data analytics tools presently proposed on the market, we will scrutinize the 10 most outstanding data analytics tools required to make the promising enterprise.
1. R
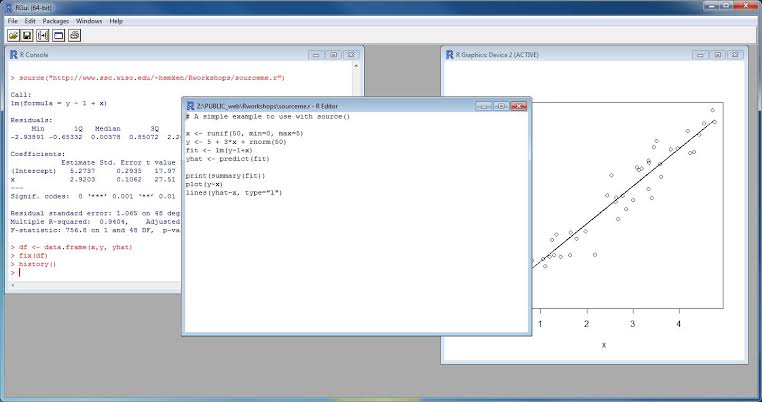
Source: ssc.wisc.edu
R is the dominating data analytics tool in the market that is widely employed for statistics and data modeling. The tool can effortlessly alter or manipulate your data and demonstrate it in diverse manners.
Being the most prominent analytics tool in the market, R has exceeded SAS(another data analytical tool) in usage. Having that quality, R is now used and chosen by companies and enterprises that can easily pay for SAS. The software has evolved to be more powerful and vigorous with time.
The enterprises that work on a large scale and have excessive data can opt for this tool. For the reason that it can now manage large data sets much more expertly than it used to, a decade prior. Not only that but It has also evolved to be a lot more versatile and multi-purpose.
Moreover, this programming is free to download.
In between April 2015 and April 2016, 1800 fresh packages were initiated in R. The entire number of R packages now exceeds 11,556. Some concerns are present regarding the abrupt number of packages.
Regardless, they have necessarily expanded a lot of R’s proficiency. Now, this tool blends very satisfactorily with numerous large data platforms. And, they have ultimately participated in the tool’s victory.
Operation of R on any system
The simple way to run R on almost any system including MAC or Linux is:
- Visit the official site of R programming.
- Click the CRAN link present on the left sidebar.
- Choose a mirror.
- Click on download.
- Download the latest package of R.
- Run the file and follow the steps present in the instructions to install R.
How to use R
After installing the software on your system, you can use R for the following purposes:
- To create custom data collection
- Clustering
- Analytical models
- Create statistics engines
2. Python
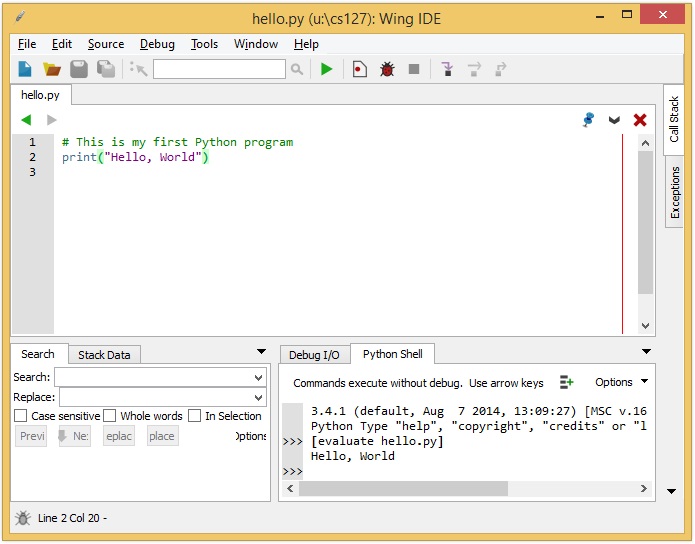
Source: web.cs.iastate.edu
Python is an object familiarized script language that is simple to read, write, maintain. With that, it is a free open-source tool and supports both functional and structured programming.
The programming language of Python has been one of the vital languages of programmers since its birth. The major reason for its prestige and success is the evidence that it’s an easy-to-learn and quick-to-run language.
Nevertheless, the software enhanced into one of the significant data analytics tools with the growth of analytical and statistical libraries such as NumPy, SciPy, etc.
At this age, the tool carries an extensive range of statistical and mathematical processes. That makes it incredibly efficient and popular in the market.
Thomas Carlyle, a Scottish writer says,
“A person who is gifted sees the essential point and leaves the rest as surplus.”
Now, as the digital age has initiated rapidly, we are observing that programmers and other tech folks are shifting into analytical tools. Most of them are already aware of Python, and thus, Python has thrived to be a data analytics tool of preference for many data scientists and analysts.
How to use Python
Python is used for various purposes. You can easily download the software on your system and benefit from the services it offers including build control and management, testing, support language, etc. Watch this video tutorial to learn more about it.
3. SAS
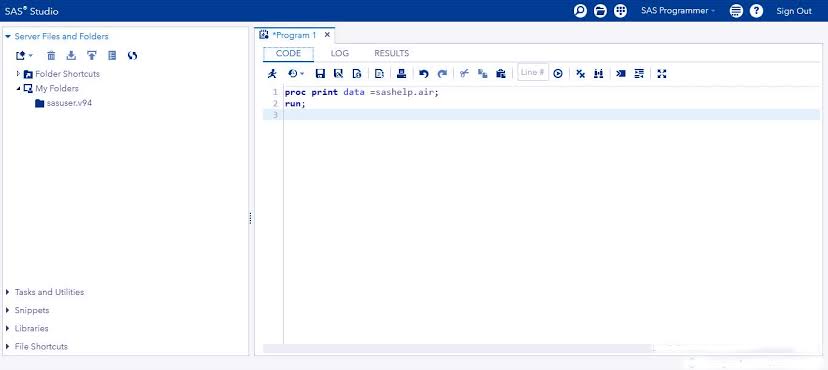
Source: DataFlair
SAS is one of the most used data analytics tools in the market. This is a programming setting and terminology for data manipulation. It is a boss in analytics which was created by the SAS Institute in 1966 and further improved in the 1980s and 1990s.
The tool is easily available, manageable, and can assess data from any reference. That makes it the best tool in the market. SAS launched a huge set of creations in 2011 for consumer understanding. With that, it also launched several SAS modules for web, social media, and marketing analytics that are commonly used for profiling clients and probabilities. Some of the technological modules that have been developed in the recent yore are – SAS analytics for IoT, SAS Anti-money Laundering, and SAS Analytics Pro for Midsize Business. The tool can also foresee the manners of the enterprise’s clients, and then manage, and optimize information.
Moreover, there is some flexibility on pricing from the SAS Institute that has supported its cause. SAS is a vigorous, versatile, and simple to understand software.
How to use SAS
SAS is simple to understand and gives an easy selection for people who already know SQL. Even oppositely, it has a nice durable GUI interface in its warehouse. In terms of help, there are tutorials accessible on websites of several universities and SAS has extensive documentation. You can access them to use it on your system.
4. Tableau
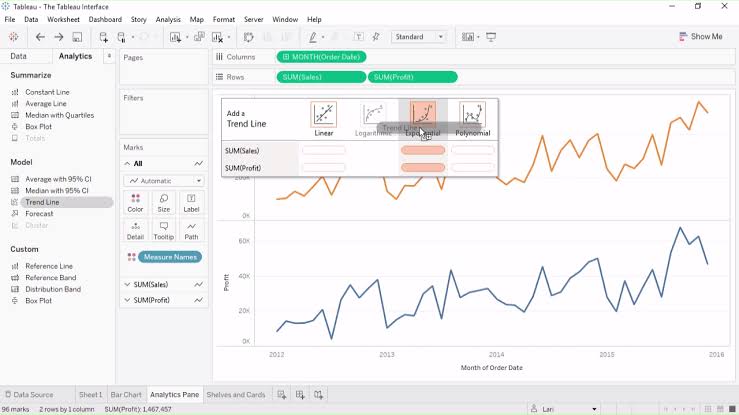
Source: Tableau
Tableau is among the extensive and easy-to-learn data analytics tools that conduct a beneficial function of chopping and mincing your data and giving rise to tremendous visualizations and dashboards.
Tableau Public is a free analytics tool that attaches to any data stream. Best corporate data repository, Microsoft Excel, or web verified data and develops data visualizations, charts, dashboards, etc. with substantial updates illustrating on the network.
These sets of data can also be sent through social media to the customer. The tool enables the way to download the file in several layouts. If you expect to see the strength of the tableau, then you must have a very reasonable data basis.
Tableau has large data capacities that make it significant. Moreover, this feature can help evaluate and envision data adequately as compared to any other data visualization software in the market.
It can build promising visualizations than Excel and can most certainly regulate much more data than Excel can. If you want interactivity in your diagrams and charts, then Tableau is certainly a direction to go.
How to use Tableau
Following are the steps that a beginner needs to follow to use tableau:
- Attach Tableau to your data.
- Drag and plop to take the first look.
- Focus on your outcomes.
- Examine your data geographically.
- See the details.
- Create a dashboard to exhibit your ideas.
- Create a story to illustrate.
- Share your opinions.
5. Apache Spark
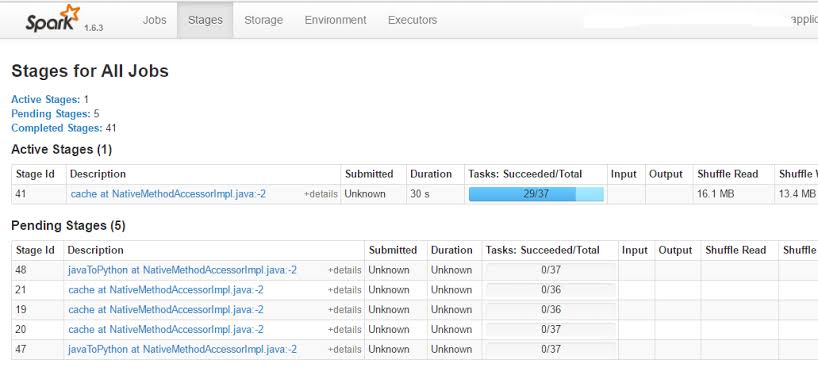
Source: Stack Overflow
Apache Spark was created in 2009 by The University of California, Berkeley’s AMPLab. Spark is an open-source processing associate that is created with an emphasis on analytics, particularly on undeveloped data or large amounts of data.
It has evolved to be one of the enormously prominent data analytics tools in the previous few years. There are various reasons for that including an easy understanding and the Hadoop ecosystem is another one of them.
The software is quick and processes data at the large-scale. After that, it implements applications in Hadoop assortments 100 times quicker in storage memory and 10 times quicker on the disk drive.
Spark is created on data science and its impression gives rise to an effortless understanding of data science. It is also prominent for data channels and device learning prototype creation.
The tool also entails a library that is MLlib which makes it outstanding among other tools. It offers an advanced gear of machine algorithms for redundant data science procedures such as classification, reversion, collective filtering, assembling, etc.
How to use Apache Spark
You can download and install Apache Spark on your system. After that, you need to set up the system and verify spark installation. With that being done, you can easily use it according to your preference.
6. Microsoft Excel
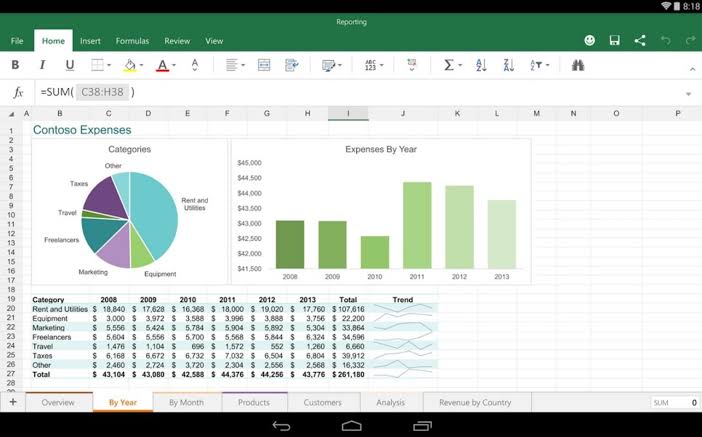
Source: uptodown
Microsoft Excel is a significant, prominent, and most used data analysis tool that is present in almost all businesses. Either you are a specialist in Sas, R, Python, or Tableau, you still require to utilize Excel for grunt work. Non-analytics experts will usually not have a way to use tools such as SAS or R on their systems. However, everybody has Excel. Excel comes to be critical when the analytics team interfaces with the business steam.
Being an important software of the market, it has got a lot of fame. It has become a significant tool when there is a regulation of analytics on the client’s interior data. The tool evaluates the complicated function expertly and outlines the data with a preview of charts. The charts help in screening the data as per customer mandates.
The software has the developed business analytics preference that assists in designing capacities. It also has prebuilt preferences like instinctive connection detection, the production of DAX measures, and time assemblage.
How to use Microsoft Excel
The basic function you can use in Microsoft Excel are:
- Building a new spreadsheet from scratch.
- Performing basic analyses in a spreadsheet, like adding, subtracting, multiplying, and dividing.
- Writing and formatting section script and titles.
- Using Excel’s auto-fill features.
- Enlarging or removing single columns, rows, and spreadsheets.
- Maintaining column and row titles noticeable as you scroll past them in a spreadsheet.
7. RapidMiner
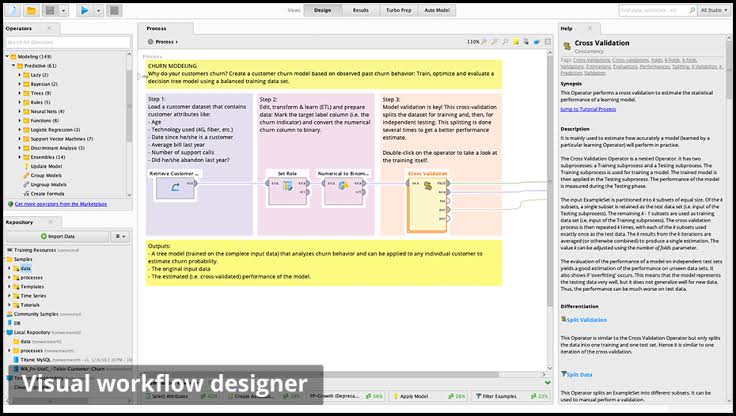
Source: RapidMiner
RapidMiner is an influential combined data science software that is created by the same company that conducts a predictive inspection and other refined analytics including data mining, script analytics, device learning, and graphic analytics without any programming.
RapidMiner is another data analytics software that provides all the technology users’ requirements, from integration, cleaning the data modification before they operate predictive analytics and create statistical prototypes. All these functions are accomplished by users through a modest visual interface.
This tool can also be enhanced by utilizing R, Python, and several other third-party plugins that are accessible in the marketplace.
The software can integrate with any data source types, such as Access, Excel, Microsoft SQL, Tera data, Oracle, Sybase, IBM DB2, Ingres, MySQL, IBM SPSS, Dbase, etc. Such a diverse functioning of the software makes it an extremely amazing and top-notch analytics tool. This software is very substantial and can develop analytics founded on significant data modification settings, i.e. you can regulate the layouts and data clusters for requiring assessment.
How to use RapidMiner
You can install and use RapidMiner easily according to your requirement. The steps needed to install are:
- Get ready for the installation.
- Build a database server, if essential.
- Download RapidMiner.
- Install and configure.
- Begin the server and finalize the web-based network.
- Attach to RapidMiner Studio.
Other than that, to learn more about the tool, you can watch this playlist consisting of several tutorials that you may need.
8. KNIME
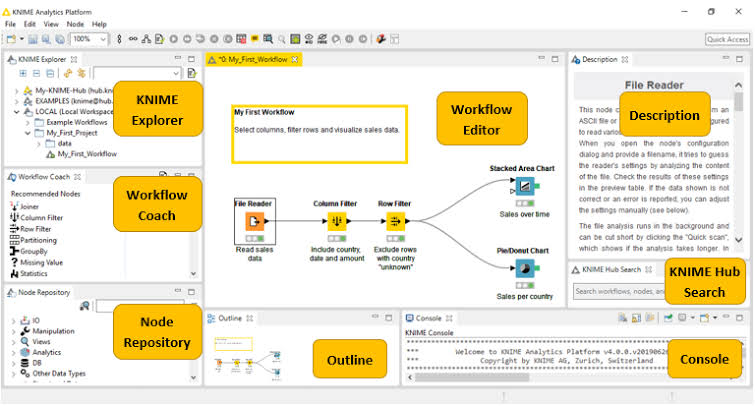
Source: KNIME Documentation
KNIME stands for the Konstanz Information Miner. KNIME data analytics tool was developed in January 2004 by a squad of software engineers at the University of Konstanz.
KNIME is a steering open-source, documenting, and integrated data analytics tool that enables you to evaluate and design the data via visual programming. It incorporates several ingredients for text mining and tool understanding through its modular data pipelining concept with minimal or no programming requirements.
KNIME is excellent for data scientists who do not innately have competent programming mastery and need to integrate & process data for constructing machine learning and other statistical prototypes. Its pictorial interface enables point-and-click examination and modeling.
How to use KNIME
KNIME is simple and very flexible to use. It is very quick and assists the user quickly. If you still find it difficult to use, you can see any YouTube video or KNIME experts video to understand its functions.
9. Google Data Studio
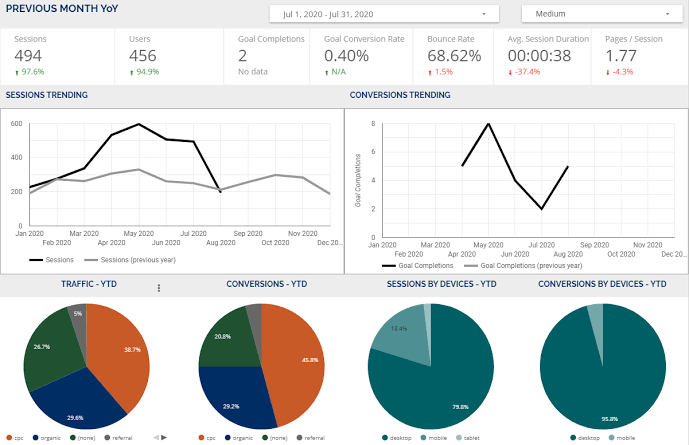
Source: Search Engine Journal
Google Data Studio is one of the prominent free data analytics tools for demonstration and data illustration. It automatically incorporates with most other Google applications, including Google Analytics, Google Ads, and Google BigQuery.
Data Studio turns your data into informational, easy to read, easy to share, and fully customizable dashboards and summaries. The data control turns any report into a creative template document that anyone can use to distinguish their data
Google Data Studio is excellent for those users who prefer to analyze their Google data due to its intersection with other Google functions.
For instance, marketers could establish dashboards to enable analyzing customer modification and retention for their Google Advertising and Analytics outcomes. Data Studio can operate with data from various other references as long as the data is duplicated first to BigQuery utilizing a data channel such as Stitch. Such functions make the Google Data Studio easy to use and highly accommodating as well.
How to use Google Data Studio
After installing the tool on your system, you can follow the following steps:
- Log in to Data Studio at datastudio.google.com.
- Accustom yourself to the dashboard.
- Connect with your first data source.
- Establish your first report.
- Put in some charts.
- Customize the configuration and add a title and headlines.
- Share the report.
10. Jupyter Notebook
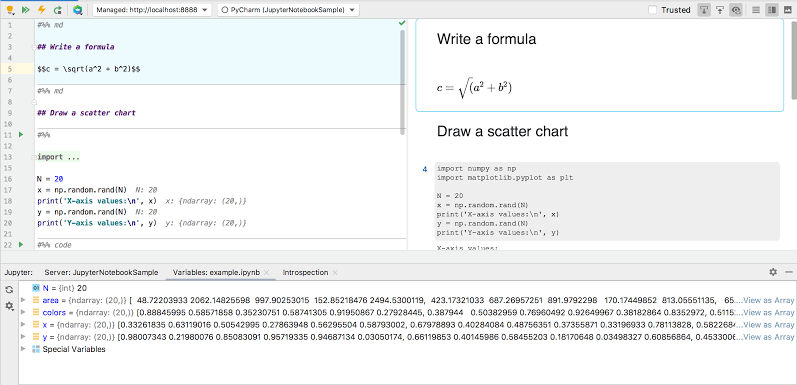
Source: JetBrains
Jupyter Notebook is one of the effective, free, open-source, and online data analytics tools that can be performed in a browser after installing it by using the Anaconda platform or Python’s package manager, pip.
It facilitates the creators to produce reports with Live Code Data and impressions. This data analytics software aids more than 40 programming terminologies. This tool was previously known as IPython Notebook for the reason that it was originally developed using Python.
Moreover, it enables creators to give rise to the use of Python’s broad variety of analytics and visualization packages. And lastly, this tool has an enormous group of users who also use additional languages.
The uses of this tool include data cleaning and modification, numerical simulation, statistical analysis, modeling, machine learning, and much more.
How to use Jupyter Notebook
What you need to do to initiate a Jupyter notebook is open your terminal and direct towards the site where you would like to maintain your notebook. Then type the command jupyter notebook and the software will instantiate a local server at localhost or another established anchorage.
11. Grafana
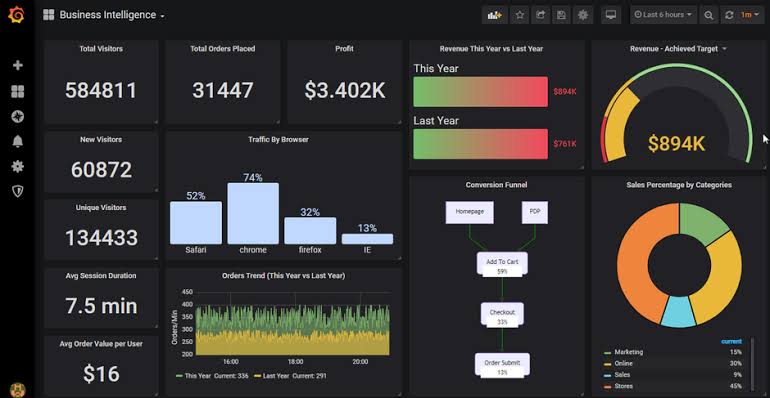
Source: MetricFire
Grafana is a free, open-source data analytics software for scanning and examining metrics across several databases and applications. This software offers a real-time impression of superficial procedures and warns users when such events come about. Grafana is widely wielded for tracing their applications by tech and DevOps engineers. Such features help the businesses to work efficiently and offer high-quality services.
How to use Grafana
You can use Gradan for following purposes:
- To create the dashboard, click the Home dropdown menu in the top-left nook and select New.
- To add a metric to a chart, click the headline of the panel and select Edit to open the graph editor.
- To apply a function to a group of metrics, you need to open the graph editor, click the + icon, and choose the function to pertain to.
12. Redash
Source: GitHub
Redash is a small and cost-effective data analytics tool that queries data sources and creates visualizations. The code is open source, and for enterprises that want to begin rapidly. It also had an inexpensive host version. Redash’s core function is a query editor, that offers a rapid interface for proposals, strategies and integration supervision. The search results are hoarded in Redash, and users can automatically plan revamps.
How to Use Redash
To startup, you need to log in first. After that, you’ll see the welcome screen that asks to attach a data source. Attach that. Build your first query and establish your first dashboard. You can also watch this extensive video teaching how to use Redash.
Conclusion
Carly Fiorina says,
“The goal is to turn data into information, and information into insight.”
Business analytics is a procedure or equipment to make a realistic marketable decision. Hence it influences the functioning of the entire community. With that, these data analysis tools also aid in evaluating and regulating the continuous conformance of data to the business regulations after interpreting the data integrity for the business.
Consequently, business analytics help to enhance the profitability of the enterprise, boost market share and revenue and give a decent retrieval to a shareholder.
If you don’t use any analytics tool, we recommend you to do so as early as you can. Do not be like people who eat snails because they don’t like fast food. That is silly.
To actually grow your enterprise, you need to install any suitable analytics tool. You can choose from the above-listed listicle that includes the famous and revamped data analytics tools of the analytics market.
Who uses data analytics tools?
Data Scientists and Data Analysts use data analytics tools in their exploration and businesses. They use the tools to help observe data correlations and make more mindful conclusions.
What are the skills of data analytics?
There are numerous skills in data analytics. However, we have enlisted a few of them below:
- Research
- Problem-solving
- Data mining
- Reporting
- Organizing
- Data and metrics interpretation
References
https://www.google.com.pk/amp/s/www.proschoolonline.com/blog/top-10-data-analytics-tools/amp
https://www.google.com.pk/amp/s/www.jigsawacademy.com/10-most-popular-analytic-tools-in-business/
https://www.codecademy.com/articles/how-to-use-jupyter-notebooks
http://www.analyticshero.com/2012/10/25/31-essential-quotes-on-analytics-and-data/