The term Correlation Coefficient may sound somewhat scary, but allow me to explain it to you in simpler terms. Have you ever found yourself comparing the effect of one occurrence to another? Well, then you have already applied this statistical term in your life. You just don’t know the maths behind it yet.
In this article, I’ll help you better understand the correlation coefficient in simple terms and why it is so important. I’ll include some straightforward and easy-to-follow steps that you can follow the coefficient. So, let’s start without any further ado and get into it.
In the article below, we shall discuss the following branches of the statistical term correlation coefficient:
- Correlation Coefficient Definition and its purpose
- Some Uses Along with Its Several Types
- Steps To Calculate the correlation coefficient
- The Meaning Behind Every Variable Used to Calculate It
- Limitations of the Correlation Coefficient
What Does the Term Correlation Mean?
In technical terms, the word Correlation refers to how two variables are associated with one another statistically. Since both variables are dependent upon one another, we can estimate the value of the other variable if we know the value of the first variable. Overall, the range of the correlation remains between –1 and +1.
1. Positive correlation
The correlation between two variables can be considered positive if it is greater than zero and less than one.
2. Negative correlation
Similarly, the correlation between two variables is considered negative if it is less than zero.
3. Perfect correlation
The correlation between two variables is considered perfect when it is either equal to a positive one (Perfectly Positive Correlation) or equal to a negative one (Perfectly Negative Correlation).
4. Zero correlation
If both of the variables are entirely independent of each other, then their correlation is equal to zero.
What is the Correlation Coefficient in statistics?
The correlation coefficient is the measure of how strongly one variable may be dependent upon another variable and is denoted by the symbol “r”. This is the linear measure of the variable’s dependency, and its values are always within the range of +1 and -1. Let’s move on to further sections to see how it’s used and calculated.
What Is the Purpose of Using The Correlation Coefficient?
We often employ this comparison method in our daily lives without even knowing it. One example of this could be how exercising more would lower the fat content in our bodies (Negative Correlation), or the greater the carbon emissions, the greater rate of increase in global warming (Positive Correlation). Lastly, the existence of cats with that of trees would have zero correlation since they’re entirely unrelated.
How many types of Correlation analyses are there?
As a general rule, there are four types of correlation analysis that are conducted in statistics. They are the Pearson correlation coefficient, the Spearman’s rank correlation coefficient, the Polychoric correlation coefficient, and the Covariance correlation coefficient.
1. Pearson Correlation Coefficient:
The Pearson Correlation Coefficient is the simplest one; it calculates the linear relation between the two variables.
2. Spearman’s Rank Correlation Coefficient:
The Spearman’s Rank Correlation Coefficient does not require any parameters. It calculates the monotonic relationship between two variables.
3. Polychoric Correlation Coefficient:
The Polychoric Correlation Coefficient can be used to extract and understand the relation between two Gaussian distributed continuous data sets. These values are then used to create a scale to compare all similar values.
4. Covariance Correlation Coefficient:
The Covariance Correlation Coefficient is calculated when you have to deal with a normally distributed relation between the variables.
How To Calculate The Correlation Coefficient (With Steps)?
This formula may look a little appalling, but once you go over the steps to calculate the correlation coefficient, you will not find this formula frightening.
Before moving on, think of a pair of variables; let us discuss the relationship between carbon emissions and global warming. Now put the carbon emissions on the x-axis and global warming on the y-axis.
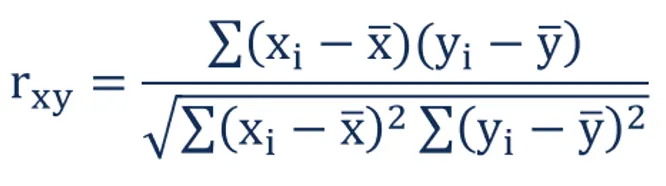
1. Finding Sample Means:
The sample means or the x-bar and y-bar values in the formula can be calculated by summing up the x and y values, respectively, and dividing them by the total number of x and v data points in the set.
2. Calculating the distance of each data point from the mean:
Calculating the distance is a rather lengthy process because you have to subtract the x mean from each x data point and subtract the y mean from all of the y values to find the distance of each point from the mean. You need to keep in mind that you might also be getting some negative or zero values but do not let that scare u.
3. Complete the top and bottom of the equation:
In order to complete the top half of the equation, you need to sum up all of the products. Similarly, for the bottom half, you need to sum up the squared values of x and multiply it with the sum of the squared values of y and then take the square root of that final product. Finally, all you have to do is divide both answers, and you have your correlation coefficient.
Meaning Behind the Values of The Correlation Coefficient:
The value of the correlation coefficient (r) variates between –1 and +1. When it is a positive value, that means that both of the variables are directly proportional to each other, i.e., they both increase or decrease together. In contrast, the negative value of r indicates that the variables are indirectly proportional, which means if one value increases, the other one decreases. The closer the value is to a zero, the weaker the relationship is. To find how strongly they are related, we draw the line of best fit on the scatter plot after drawing all of the data points, and if the dots can be connected through a single straight line, then the relation between them is linear.
r = Correlation Coefficient
x (i) = x-values of the sample
x (bar) (i) = mean of the respective x-values
y (i) = y-values of the sample
y (bar) (i) = mean of the respective y-values
Limitations of Correlation Coefficient:
Although the correlation coefficient is a handy method to calculate how changing one variable would affect another one; unfortunately, this method restricts us from comparing the relationship between only two variables at one instance. For example, this method would provide us with inaccurate values for curvilinear relations.
Learn More About Statistics
-
What Are the Three Criteria for Causality?
Understanding the process, how things work, how one event leads to the other, or the famous concept of the butterfly effect, all these ideas relate to causality in one way
-
What are the Five Time Series Forecasting Methods?
The appreciation of the notion that time is priceless has led to the implementation of several dynamic decisional technologies in day-to-day business decision-making, where time and business revenue are directly
-
An Introduction to Statistical Power And A/B Testing
Statistical power is an integral part of A/B testing. And in this article, you will learn everything you need to know about it and how it is applied in A/B testing. A/B
Wrap Up
In short, what the correlation coefficient calculator does is that it calculates and compares the distance of each data point by the mean values and tells us how strongly related two variables are in a linear relationship according to the line of best fit.
I hope you found this article informative. For more information on this topic, click here.