Both nationally and internationally, e-commerce is playing a vital role in the marketplace. It has been growing at a high speed with more people purchasing things online rather than buying them from the traditional retailing stores.
E-commerce and data visualization are two different streams, but, if put together with the right strategic plan, it reinforces your vision. However, what is the role of data visualization in e-commerce?
Data visualization in this data-driven world, allows you to interpret your customers by providing you an insight to enhance your sales strategy and helps you to build the customer relationship by enriching their buying experience along with feeding their needs. It has not only reduced manual labor but has also streamlined the entire process of e-commerce.
In the traditional retailing stores the customers directly interact with the sellers. They have this advantage to see and analyze the behavior of their customers, knowing who they are dealing with and what they would prefer.
But the online retailers subside to the backdrop when it comes to understanding the customer. Nonetheless, the e-commerce industry has the opportunity to embrace inventions to prove their existence and demonstrate their capability to build a valuable relationship with their customers.
Highly Recommended Article: This is How Data Science Improves Business Efficiency
What is happening in the world of e-commerce today?
To enhance the circumference of commercial success, the e-commerce industry has succeeded to deliver new technological inventions. From determining the demographics, tracking the customer engagement to identifying the existing points, data visualization is doing it all. Data visualization is an excellent way to represent your data.
Who can tell this to us better than the founder of Amazon, Jeff Bezos, as he puts;
“If you do build a great experience, customers tell each other about that. Word of mouth is very powerful.”
Establishing the demographics
Who is the customer? What is their age, gender, location, or other relevant attributes? Will the customer return? Do they follow some specific brands on social media sites? Figuring out these things can be grasped to mark a big sale. It is tracked to reveal the patterns of their behaviors.
Following customer engagement
To know how the customers are engaging and interacting with your site, you can view your stream pattern from a viewer’s point of view to see how they sail between the pages. If your site is customer-friendly it will give you an edge over others because usability is prioritized by the online world. Knowing how your customers interact will help you a lot.
Highly Recommended Article: 11 Reasons Why Data Analytics is Important in Marketing
Determining the exit points
Sometimes the rates during the checkout process or drop off have a need to re-write sales copy for clarity. Improving the shopping cart experience and lowering the shipping rates can be done once you determine that where your website is losing money.
Benefits of data visualization in e-commerce
To make the best benefits out of it, you can use different ways to achieve data storytelling. You can use the following for visual resources to show what the data has to say
- Bubble charts
- Bar charts
- Line charts
- Infographics
- Mind maps
- Animations
- Timeline
You can benefit from data visualization in the following ways:
- Process large amount of data
So much information is being collected in raw form for data analysis and you might have to use a lot of mental energy to process it. But, what if there is an alternative, quick and easy way out?
This is where data visualization jumps in. Through data visualization, you can synthesize a large amount of data, retain the essence of it and save a lot of time and work.
The vast data related to your customers can be built-in forms of graphs, to represent a lot of information in a better way.
- Gain a quick insight
In the domain of e-commerce, you should get yourself prepared to not miss any opportunity for improving the customer experience. To do so, gaining quick insights into our customers’ behaviors and their navigation through your site, or what they are seeking is a key to a successful online business.
- Analyze competitors
Competitors produce some useful information for businesses to analyze. Doing it with data visualization makes it easier and simpler to compare them in relation to your site. By taking a look at what your competitors are offering will help to plan competitive strategies to make your audience happier.
- Website content
If you see a lot of written content, it gets hard for your customers to differentiate you from your competitors. Therefore, data visualization is a great opportunity for your team to make amazing content to keep the audience engaged, and to help them easily get access to the original information.
- Discover new trends and patterns
Consuming patterns of your customers are widely spread throughout the data and cannot be understood by having a look at the raw information. But if you make them visual, it will get easier for you to recognize and know how the consumers are behaving.
With the help of these behaviors, you will be able to analyze the consumer trends on the basis of which you can provide your customers with more opportunities.
How well-designed data visualization can help your business?
“By visualizing information, we turn it into a landscape that you can explore with your eyes. A sort of information map. And when you’re lost in information, an information map is kind of useful.”
– David McCandless
Data visualization is not about only creating a pretty design; it is a difficult task. Creating a design with a fake mockup can look great but when it comes to put the real data issues begin to show up. If a designer fails to consider the data being used, your charts can end up looking too cluttered or too sparse.
To avoid such happenings, using a data visualization tool can save you by managing both the design and underlying story of data. It will provide an ease to your customers to interpret what they are seeing.
If you guys wish to learn more on how you can use data visualization in business, click here.
Examples:
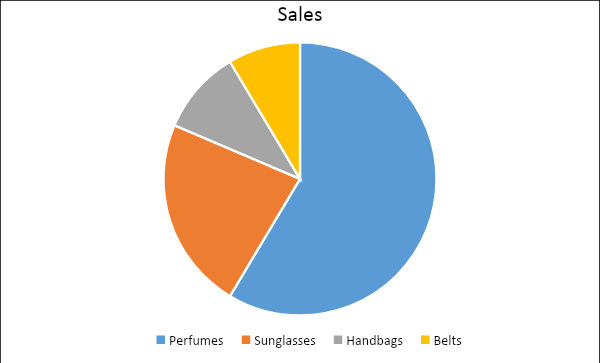
Say, for example, you have to keep a check on the sales of each product. This kind of representation is typically in the form of a pie chart. It can be represented this way.
Examples of data visualizations used for e-commerce
Bar graphs
Simple bar graphs are the most effective ones to communicate the difference that exists between two groups of data or the changes occurring in them.
Line graphs
Line graphs are most commonly used to compare two different sets of information over the same period of time.
Combination graph
By combining two different graphs you will be able to show the information in a different way. For example, you can merge both line and bar graphs.
Pie charts
It is the best graph to represent the part-to-whole relationship. You can compare the channel in your revenues such as content marketing, outbound, or email marketing.
Area charts
If you need a better awareness of the impact of a certain product on your overall revenue, go for an area chart. These give you a straightforward visualization about how the representative segment of products will work for your business.
Choosing the right one
With the plenty of charts available, choosing the right one according to your needs is the most difficult task. You can:
- Use a line graph to analyze trends
- Use a pie chart to compare percentages
- Use a bar graph to show the distribution and so on.
For choosing the right chart for your business, firstly, consider the kind of chart that makes more sense to your data. Just like a good e-commerce agency will consider which kind of visualization technique is the best for their users to interpret data.
Tools for data visualization in e-commerce
The main aspect of data visualization in e-commerce, as mentioned earlier is the way you represent your data to your customers. You have to only add the information that will be useful or interesting for your customers.
In order to achieve your desired goals, here are some important tools for data visualization in e-commerce.
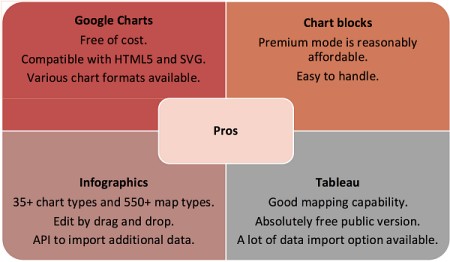
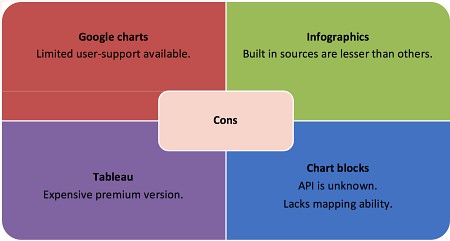
Google charts
Google charts are easily customizable and are used to make scatter plots and charts that can be viewed on both, the phone and desktop.
Chart blocks
With the help of API, you can bring in information from anywhere in it. To bring in the information is a matter of a view clicks but it is a bit more complex than some other applications. Especially the ones having automatic modules or extensions for some particular data points.
Tableau
Using Tableau, the users can do visualizations via drag and drop, which can be shared with a click. The main pros are that it is easy to use and can connect to any database.
Infographics
With infographics, you can make the process of storytelling as simple as it could possibly get. With a number of alternatives, it is a user-friendly tool.
What are the uses of these tools?
Using these tools can help us to make business decisions accordingly. It paves the paths of the businesses to understand their strengths and weaknesses so that they can work hard on those areas.
Using charts, tables and graphs also helps the customers to know the trending options and they get to know how shall they be using their earnings.
Pros and cons of the data visualization tools
What is missing in these tools?
In spite of the technological advancement, there are a few metrics missing in the market. The next wave of digital tools will bring the following, that, for now, is missing in the tools:
- Order frequency
- Customer churn
- Average order amount
- Customer lifetime value
- CLV with margin
- Customer acquisition cost
What is a dashboard and why is it needed?
A dashboard can be said as a tool that communicates high-level information and business intelligence. It tracks the important metrics related to the success of the company, can be considered as a snapshot of the business.
Need of the dashboard
To visualize your data in the quickest way using a chart, you will need a dashboard. It will give you quick access to the important metrics for your business. To make a user-friendly dashboard, make information clear and fast to interpret. Your user should be able to understand the data in a few seconds without errors. They should be user-oriented and should adapt to the user’s needs.
Requirements of visualization dashboard
The users can get in-depth details of business by drilling down into it. You can make the data visualization dashboard effective by following these steps:
Step No. 1: Start off with clean data, which the basic requirement of every meaningful analysis. It should be free from errors, complete, and to the point.
Step No. 2: Study your audience. The head of your business is more interested in the different metrics rather than a person working as an inventory manager.
Step No. 3: Provide information that is easy to interpret.
Step No. 4: Organize the information in a logical layout.
Step No. 5: The last and the most important step is to limit the visualization from 5 to 9 maximum. Adding more than that will not put a good impression.
Bottom line
It is not wrong to say that visuals are a great asset for e-commerce businesses as they help companies to name their digital game. Since the technology is still in infancy, the users can only see the items you offer on the screen and they cannot experience them. This being the case, visuals should provide a more comprehensive understanding of your services and products that you offer. Here is the summary of the tips:
- Opt for a data-driven business decision with visualizations so that you can clearly see the positives and negatives of your business.
- Use charts, tables, and graphs for advertising purposes that should directly target your audience.
- Use visuals for social media platforms to add a more interactive element to it.
What is the main purpose of visualizing data?
Data visualization helps to represent the stories by turning data into an easier form to understand and highlight the trends and outliers.
What is the role of data visualization in business analytics?
Data visualization means presenting data in pictorial or graphical format. It helps the decision-makers to interpret analytics presented visually so they are easy to grasp.
References and Further Reading
https://www.yaguara.co/blog/why-data-visualization-is-essential-to-ecommerce-teams
