The term “data” refers to collecting raw facts and figures. But with the evolution in technology and the fourth industrial revolution, “data” got its new meanings. With the advent of big data analytics, the data is regarded as the information stored on the computer, transmitted or retrieved via the internet. Such large volumes of data residing in the centers need to be analyzed so that the findings and analysis can lead to an adequate decision.
Descriptive Analysis Explained
Limiting the word “data” to facts and figures would not be justice; Different fields define data according to their terminologies. The same is the case with statistics and Data Science. The sense of data expands beyond inputting parameters for computing applications and has other meanings in statistics, finance, demographics, etc. Before we dive deeper into the descriptive analysis and how it is performed, let’s first understand the data types in statistics.
- Quantitative Data
- Qualitative Data
Quantitative Data
The term “qualitative data” refers to any data that has numerical values connected with it. These data sets contain quantitative information that may be used to derive results from mathematical derivations, including mathematical computations, and can also aid statistical analysis. The employment of mathematical techniques and formulae in this data type makes controlling numerous parameters simple. Parameters such as kilos, pounds, or dollars describe quantitative data.
Using questionnaires, surveys, and polls with various questions, quantitative data highly aids statistical data analysis. The conclusions generated from the data can be linked to a particular community. Descriptive, relational, and comparison data are examples of this sort of information. If the outcomes of a specific group can be generalized to a broader population, it helps to spread the results of that group to a more significant population.
Qualitative Data
Qualitative data is a sort of information that describes something descriptively. This form of data generally comprises open-ended questions, and the data gathering approach is investigative, allowing respondents to discuss and justify their responses thoroughly. Rather than numbers or other quantitative factors, qualitative data is defined by labels, qualities, and a variety of other identifiers that are unique to each individual.
Measures of central tendencies, such as mode, median, and frequency, examine qualitative data. Furthermore, because qualitative data is translated onto charts and graphs, this data type is critical for data visualization approaches. Using suitable coding standards and tools, trends in the data may be recognized. This method assists researchers in identifying trends that are relevant to their research topics and in data processing.
This article will go through everything you need to know about descriptive statistics and how to analyze it. What tools and strategies do you need to conduct a thorough study of the data you’ve gathered? So, if you’re a research student who’s having trouble with statistical analysis and aren’t sure which approach to apply, we’ve got you covered. If you read the article to the conclusion, you will get all the answers to your concerns.
What are descriptive statistics/ data analyses?
Descriptive Statistics refers to describing the data in a meaningful way that elaborates the findings, presents and summarizes them using infographics such as charts and graphs that are more understandable for the audience. It also helps extract the patterns from the datasets. It is to be noted that the descriptive data analysis doesn’t allow us to conclude our research and decide about the hypothesis made. It is just meant to describe the data.

Significance:
With the advent of big data and the ever-increasing amount of information, it has become obsolete to present raw data and its findings to the audience. It becomes difficult for people to visualize and comprehend the actual crux of data. For this purpose, Descriptive Statistics plays its role in helping people interact and interpret the data.
Consider a manager who wants to see the performance of his 50 employees and is interested in observing the group’s overall performance. This can be easily accomplished by descriptive data analysis with the help of statistical measures and other infographics such as charts and graphs. Following statistical measures best describe the descriptive data and prove valuable in presenting the outcomes.
- Measures of Variability: Measures of variability help the users identify how varied or similar the results are from a group of data values. It summarizes the data in groups and shows how much spread the data is in the set.
Measures of spread help summarize how to spread and scatter the values are from the mean value. For this purpose, many statistical steps are available such as variance, quartiles, absolute and standard deviation, etc.
- Measures of central tendency: These statistical measures help identify the categories and all the variables. Measures of central tendency include Mean, Median, and Mode. Mean is calculated by performing arithmetic operations on the data and taking its average. Median refers to the middlemost value in any quantitative data or sorted quantitative data. Lastly, mode is simply the most frequently occurring value in the data, whether qualitative or quantitative. Mode helps you separate the categories and variables under each category from discrete data.
The main concern for the measures of central tendency is to focus on the average computed values of the datasets. Infographics such as graphs and simple tables are enough to convey the meaning of analyzed data. Such measures focus on the central positions of the distributions in given datasets. Then, the frequency in the frequency distribution table is observed and analyzed using measures of central tendency such as mean, median, and mode.
Descriptive statistics are used to define or summarize the characteristics of a data set, such as the mean of a variable, standard deviation, and frequency distribution. On the other hand, Inferential statistics help people comprehend the properties of the elements of a data set that are collective for others.
What is included in the descriptive analysis?
Descriptive Statistics are widely used to manage the quantitative data descriptions and present them in more acceptable ways. During the research, a person can encounter a lot of measures and get confused about which one to use. With the increasing datasets, the strength of data sets can also be the factor of confusion about which tool to use to analyze the data. Descriptive statistics help a lot in this regard. This procedure is used to simplify large volumes of complex datasets practically. The descriptive statistical measures reduce the complex datasets and provide the summary to present the results quickly.
Steps in Descriptive Analysis:
Following are the general steps to perform descriptive data analysis in MINITAB and can prove valuable for newbies who are not familiar with the latest tools and tactics for the descriptive data analysis.

- Describe Sample Size
The first step for getting started with descriptive data analysis is to decide the number of observations you will work with; the sample size. It is typically presented as “N.” The first step is defining “N” for your dataset.
A question that would arise in most minds is how many observations we should work with? The answer is that working with a medium-sized or large dataset is suggested to achieve accurate findings. Such several observations will be more than enough to present the data distribution. Professionals suggest that 20 to 50 observations on average can provide precise estimates of the parameters and produce adequate findings.
- Set the Center of your Dataset
As the measure suggests, the center of data is set using measures of central tendency such as Mean, Median, and Mode. To find the center of a dataset, the median can be used. It’s often regarded as the standard measure to find the center for data distribution. Although the mean is also a measure of central tendency, the median is more reliable because it is less affected by the anomalies (the outliers) than the mean.
- Use Measures of spread to describe variability in the data
As discussed earlier, measures of spread or variability show how much your data is spread from the central value. For this, measures of dispersion such as variance and standard deviation are used. Low deviation means the data is more centered around the mean value, while a higher one indicates that the data is spread out.
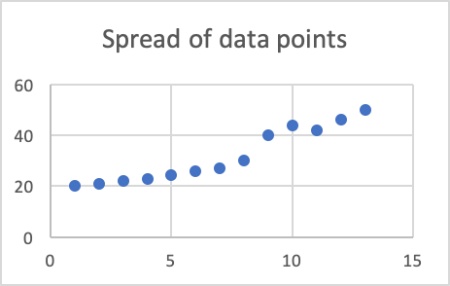
- Detect the variations in your data
Examine the data points from your data. The degree of spread in data points shows the variation in your data – how much your data varies from the central or mean value.
- Observe the shape of data distribution
After all the values are listed and plotted, observe the patterns and the frequency distributions using Histograms. Identify the plots for individual values and the box plots to evaluate the shape. Find out the shape and the anomalies in the distribution of data.
- Examine the Skewness of Plot
The next step is to examine the skewness of the created plot so that you can get an idea about where most of the outliers lie. If the plot is positively skewed, the anomalies lie on the right side of the distribution, and if it is negatively skewed, the outliers lie on the left side of the distribution. Histograms and box plots serve a lot in this regard and are widely used by statistical professionals.
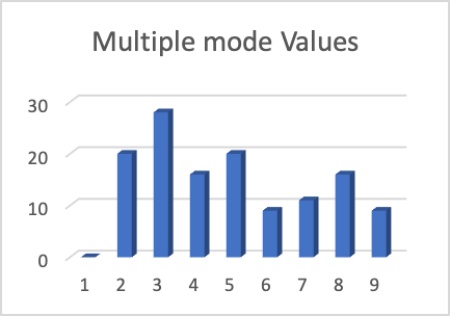
- Incorporate Easy Classification of groups
Use multiple modes in the datasets to make it easy to classify the data values and enable having various peaks. This additional information helps to create group variables. After that, creating graphs from those group variables will help find if those variables are participating in creating the peaks of the distribution.
- Group to group comparison
Use the group variables to compare data from multiple groups and perform a thorough analysis.
- Detect Anomalies
Use a box plot to identify the values far away from the distribution center. The outliers play an essential role in the descriptive analysis. The (*) in the box plot indicates the anomalies.
Descriptive Analysis for SPSS:
SPSS is a program that allows you to modify and analyze many types of data. These data can originate from various places, including scientific studies, customer databases, Google Analytics, and even a website’s server log files. SPSS can open all popular structured data file types, including spreadsheets from MS Excel or OpenOffice, plain text files (.txt or.csv), and more.
Like other statistical analysis software, Statistical Package for Social Sciences (SPSS) also uses its descriptive analysis procedures to analyze multiple variables, be it continuous numeric variables.
The table below describes the number of procedures SPSS can compute and provide adequate descriptive analysis for the given data.
| Number of responses (N) | Mean Value |
| Min Value | Max Value |
| Standard Deviation | Variance |
| Range | Skewness and Kurtosis |
- To use the Descriptive analysis procedures, run the software and go to the ‘analyze’ tab.
- From the drop-down menu, click Descriptive Statistics
- You will encounter several descriptive statistical measures.
- Such procedures compute Mean, Median, and Standard Deviation by default
- SPSS also allows users to choose how their output is displayed. Such as ascending or descending mean values, alphabetical order, or displaying the list of variables.
-
Can Data Analysis Be Automated? (We Find Out)

Not so long ago, people were used to doing simple repetitive tasks such as performing a simple linear regression by hand, which is quite a tedious task even with the
-
The Importance of Data Analysis in Research

Studying data is amongst the everyday chores of researchers. It’s not a big deal for them to go through hundreds of pages per day to extract useful information from it. However, recent
-
12 Data Analysis Techniques You Need to Know

Do you always have large sets of data to analyze? Are you looking for ways to scan the data for results easily? The good news is there are multiple data
Summary:
The gist of this whole discussion is that descriptive analysis helps summarize complex data and presents it easier for people to understand. Moreover, it also reveals various fundamental things about your data.
During the research, the students need to compute descriptive analysis. It also helps in inferential statistics to present large volumes of data, easily reducing uncertainties to a large extent. Different statistical analysis tools are available, making analysis much more accessible and free of errors. Hence, to present the data in a meaningful way, it is a widely used approach to utilize descriptive analysis and find out details about your data.
