You might be sick of hearing that information is exploding at a pace that humans cannot even fathom, keeping up with that is out of the question. The best part is that you are not expected to do so.
By leveraging our innate capacity to make a better understanding of graphics than the raw data we want to grasp machine learning and advanced analytics that are assisting humans in making sense of vast volumes of structured and unstructured data. And that is where the value of visualizations becomes clear.
“A picture is worth a thousand words.” This is an adage that we are all acquainted with. This is particularly true when attempting to clarify the perspectives gained from the study of ever-larger datasets. In the depiction of both small and large-scale data, data visualization is important.
Without any further ado, let’s explore, what are the best data visualization libraries in Python?
The top ten best data visualization libraries in Python are:
- Matplotlib
- Seaborn
- Ggplot
- Bokeh
- Pygal
- Plotly
- Geoplotlib
- Gleam
- Missingno
- Altair
What is a library?
A library is a set of pre-combined codes that are used to reduce the time required to code. They are particularly useful to access previously written frequently used codes, instead of scribbling them from scratch time and time again. Just as the physical libraries, these are a collection of reusable resources.
Humans crave narrative, and visualizations enable us to create one from our data. We have vast quantities of data everywhere in our new digital world. The majority of the data that data scientists and machine learning engineers deal with is in a structured or unstructured data format, which is difficult for humans to interpret and understand. Data visualizations are important for comprehending data.
Highly recommended next Articles:
5 Best Programming Languages for Data Visualization
A Beginners Guide to Data Visualization in Python
The best data visualization libraries in Python
Let’s have a deeper look at the best data visualization libraries for Python:
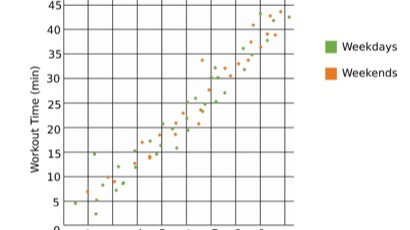
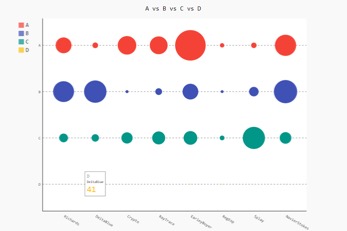
1. Matplotlib
Matplotlib is a Python plotting library that allows you to construct static, dynamic, and interactive visualizations. NumPy is its computational mathematics extension.
Despite the fact that it is over a decade old, it is still the most popular plotting library in the Python world. It was built to look like MATLAB, a licensed programming language that was established in the 1980s. Many other libraries are developed on top of matplotlib or intended to function in tandem with it during research since it was the first Python data visualization library.
Matplotlib Features
The main features of Matplotlib are:
- Some libraries, such as pandas and Seaborn, serve as “wrappers” for matplotlib. They make it simpler to use a variety of matplotlib’s methods by reducing the amount of code you have to write.
- Although matplotlib is great for getting a picture of the details, it isn’t very practical for efficiently and simply making publication-quality charts.
- Matplotlib is “extremely powerful, but with that power comes complexity,” as Chris Moffitt points out in his review of Python visualization software.
- Matplotlib has already been chastised for its standard patterns, which are reminiscent of the 1990s. Many new style impacts are needed in matplotlib 2.0, which will fix this problem.
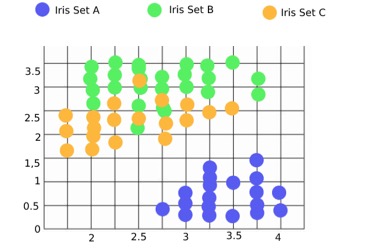
2. Seaborn
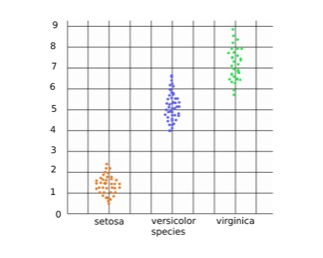
Seaborn is a Python library for creating statistical graphics. It has high-level software for creating visually appealing and insightful statistical graphics. Data scientists mostly use matplotlib for education and research, but Seaborn for publications and real-world demonstrations. Seaborn is now the industry-standard Python Data Visualization library.
Seaborn Features
The main features of Seaborn are:
- Seaborn uses matplotlib’s power to construct beautiful charts with only a few code lines.
- Its default designs and color palettes, which are built to be more visually attractive and traditional, are the main difference.
- To plot graphs, it makes use of Matplotlib.
- Its dataset-oriented plotting mechanisms work with data frames and vectors containing entire datasets, performing the requisite concept mapping and statistical aggregation internally to generate insightful plots.
- Seaborn is a fully accessible python library that we can download using the pip install function in our Python environment.
- It aims to make visualization a key component of data exploration and comprehension.
You’ll have to know matplotlib to modify Seaborn’s defaults since it’s built atop of it, which implies that it can go beyond matplotlib while having less complexity and syntax.
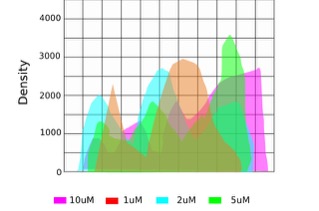
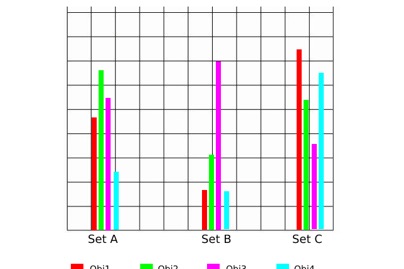
3. Ggplot
Python ggplot is a plotting library that is based on the ggplot2 library for R programming. The letter gg stands for Grammar of Graphics in ggplot, and creating graphs with it is related to writing sentences with proper grammar. It can also plot graphs using DataFrames and Series and is very familiar with the Python pandas library.
Ggplot Features
The main features of ggplot are:
- ggplot differs from matplotlib in that it allows you to overlay elements to generate a full plot. For example, you might begin with axes, then add points, a line, a trendline, and so on.
- Despite the fact that “The Grammar of Graphics” has been lauded as an “intuitive” tool for plotting, experienced matplotlib users may take some time to adapt to this new paradigm.
- ggplot isn’t intended for highly personalized graphics, according to its author. It foregoes complexity in favor of a more straightforward plotting process.
- As ggplot is an open-source library, we can simply operate it by using the pip install command in our Python environment.
Since ggplot and pandas are so closely integrated, it’s important to keep your data in a DataFrame while using ggplot.
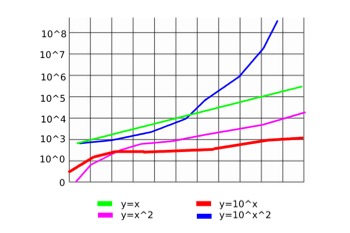
4. Bokeh
Bokeh, like ggplot, is centered on The Grammar of Graphics, but unlike ggplot, it’s a Python native, not an R terminal.
Bokeh functions well with common Python web frameworks like Django and Flask, and we can use it in Django and Flask web applications. We must first install bokeh using the pip install command before we can use it.
Bokeh Features
The main features of Bokeh are:
- Its main benefit is the ability to generate interactive, web-ready plots that can be conveniently exported as JSON objects, Html files, or interactive web services.
- Broadcasting and actual statistics are also provided by Bokeh.
- To fit different user styles, Bokeh offers three layouts with differing degrees of power.
- The highest level is for easily making maps. It has ways of making popular graphs like bar plots, box plots, and histograms.
- The middle level is similar to matplotlib in that it enables you to manipulate the basic components of each map, for example, the dots in a scatter plot.
- Developers and software engineers are aimed at the lowest level. It has no pre-defined defaults and allows you to define each chart element.
5. Pygal
Pygal, like Bokeh and Plotly, allows users to create interactive graphs that can be incorporated into a web browser. Its most distinguishing feature is its ability to export charts as SVGs. SVGs will suffice as long as you’re dealing with smaller datasets. Charts with hundreds and thousands of data points, on the other hand, would struggle to render and become slow.
Pygal Features
The main features of Pygal include:
- On operating systems, the Pygal library can be used to plot simple graphs.
- This library can be used with common Pythons web interfaces such as flask and Django to generate dynamic and interactive graphs on a web page.
- Pygal can draw a variety of graphs, including line, bar, histogram, XY, pie, radar, box, Dot, and so on.
- We can also export the charts and graphs in a number of formats, such as SVG, PNG, Etree, and others. Pygal is ideal for small web applications that involve quick and simple graphs.
- You can install the pygal library using the pip command.
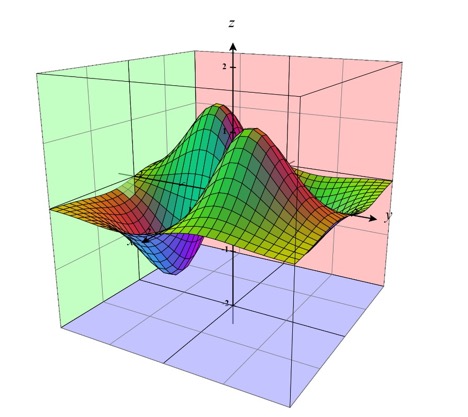
6. Plotly
Plotly is a visualization library that is used to create data visualizations for free. Plotly (plotly.py) is designed on top of the Plotly JavaScript library (plotly.js) and is used to generate web-based data visualizations that can be viewed in Jupyter notebooks or online services using Dash or saved as separate HTML files.
Plotly Features
The features of Plotly are:
- Scatter plots, histograms, line charts, bar charts, pie charts, error bars, box plots, multiple axes, sparklines, dendrograms, 3-D charts, and other chart forms are available in Plotly.
- Contour plots are also present in Plotly, which are rare in other data visualization libraries. Plotly can also be used offline, without the need for an internet connection.
- Plotly.py also supports non-web domains such as desktop editors, and binary document publishing thanks to its increasing connectivity with the orca image export feature.
Plotly is an open and accessible Python library that can be installed with the pip command.
7. Geoplotlib
Geoplotlib is a collection of tools for making maps and projecting geographic data. You can use it to render choropleths, heatmaps, and dot-density maps, among other things. To use geoplotlib, you must have Pyglet enabled.
Geoplotlib Features
The main features of Geoplotlib are:
- Most data visualization libraries don’t have a lot of support for making maps or working with geographic data, which is why geoplotlib is such a useful Python library.
- It facilitates the development of geographical maps in specific, with a variety of map types such as dot-density maps, choropleths, and symbol maps available.
One main point to remember is that installation needs NumPy and Pyglet, but this is not a huge drawback. Particularly since you want to make geographical maps, and geoplotlib is the only reliable map-making choice available. Nonetheless, most Python data visualization libraries don’t provide maps, it’s great to have one that does.
8. Gleam
R’s Shiny kit was the inspiration for Gleam.
Gleam Features
The main features of Gleam are:
- It helps you to transform your analyses into interactive web apps using just Python scripts, meaning you don’t need to know HTML, CSS, or JavaScript.
- Any Python data visualization library will fit with Gleam.
- You can add features to a plot after it’s been generated so that users can filter and sort data.
9. Missingno
Data is the asset to power a machine learning algorithm. But raw data in the actual world cannot be used without pre-processing them to a functional medium. Missing values are among the most common issues with real-time data. NaN, which stands for Not a Number, is commonly used to denote missing values. Despite the fact that the Pandas library has methods for imputing meanings to these missing rows and columns, we still need to know how, when, and how many points of NaN are transmitted in the dataset. Python added a new library named Missingno to deal with this.
Missingno Features
As we all find it a painful task to deal with the missing data, rather than strolling through a table, missingno lets you easily determine the completeness of a dataset with a visual overview. With a heat map or a dendrogram, you can process and arrange data based on completion or spot connections.
10. Altair
Altair is a Python-based numerical data visualization library. It is built on Vega and Vega-Lite, which are unambiguous languages for designing, saving, and sharing interactive data visualization designs.
Altair Features
The features of Altair are:
- With a little coding, Altair can generate beautiful data visualizations of plots like bar charts, pie charts, histograms, scatterplots, error charts, power spectra, stemplots, and more.
- Altair has requirements such as python 3.6, entry points, jsonschema, NumPy, Pandas, and Toolz, all of which are activated automatically by the Altair setup commands.
To get the data visualizations in Altair, open Jupyter Notebook or JupyterLab and run either of the code. Altair’s source code is presently available on GitHub.

What is the importance of a data visualization library?
Python libraries make it convenient to comprehend the data by displaying it in a desirable form. They provide the interface and data visualization tools in one place according to the required specifications. And they make it easy for analysts and statisticians to display that data.
Assume you studied the company’s data and discovered that one of its products was constantly losing a lot of money. Your boss might not give heed to a full document, but if you show a line chart with income as a red line that is constantly going down, your boss might be more interested. This exemplifies the value of data visualization.
Since humans are visual beings, data visualization charts such as bar charts, scatterplots, line charts, geographical maps, and so on are essential for their understanding. They provide information simply by looking at them, while you would usually need to read spreadsheets or text reports to comprehend the details.
-
The Role of Data Analytics at The Senior Management Level

From small and medium-sized businesses to Fortune 500 conglomerates, the success of a modern business is now increasingly tied to how the company implements its data infrastructure and data-based decision-making. According
-
The Decision-Making Model Explained (In Plain Terms)

Any form of the systematic decision-making process is better enhanced with data. But making sense of big data or even small data analysis when venturing into a decision-making process might
-
13 Reasons Why Data Is Important in Decision Making

Data is important in decision making process, and that is the new golden rule in the business world. Businesses are always trying to find the balance of cutting costs while
Concluding
This brings our article on the best Python Data Visualization Libraries to a close. Every Python Data Scientist should be able to visualize their data. All of the python libraries we’ve mentioned are the most common, and they’re rated by popularity and use. We recommend that you visit at least two or three libraries before settling on the right one for you.
Big Data Visualization libraries used in Data Science include Matplotlib and Seaborn. Web-applications use libraries like Plotly, bokeh, and pygal to visualise data and plot graphs and charts.
Related questions
Is python good for data visualization?
Python is relevant well beyond basic programming, considering its ease of learning. It’s included at the highest levels of data processing on a daily basis. As a consequence, Python is the language of choice for the majority of our data visualization software creation.
Which library is better, Matplotlib or Seaborn?
Bars, pies, lines, scatter plots, and other visualizations using Matplotlib are popular. On the other side, Seaborn offers a wide range of visualization patterns. Seaborn has fewer lines of code and elegant default themes, while Matplotlib is more conveniently personalized by navigating the classes.
Which is the most preferred data visualization library for python?
The most well-known Python data visualization library is matplotlib. Regardless of the fact that it’s over a decade old, it’s still the most popular plotting library in the Python world.
Is plotly free for python?
The open-source visualization libraries from Plotly are absolutely free to use, work offline, and don’t need any kind of login process. Dash Enterprise and Chart Studio Enterprise are two of Plotly’s commercial products. Plotly is a Python visualization library that is free and open-source.
References
For more information, you can visit the following sites:
- https://matplotlib.org/
- https://github.com/ResidentMario/missingno
- https://github.com/dgrtwo/gleam
- https://github.com/andrea-cuttone/geoplotlib
- https://plotly.com/python/
- http://www.pygal.org/en/latest/index.html
- https://docs.bokeh.org/en/latest/
- http://seaborn.pydata.org/index.html
- https://analyticsindiamag.com/complete-tutorial-on-pygal-a-python-tool-for-interactive-and-scalable-visualization/
- https://www.analyticsvidhya.com/blog/2020/03/6-data-visualization-python-libraries/